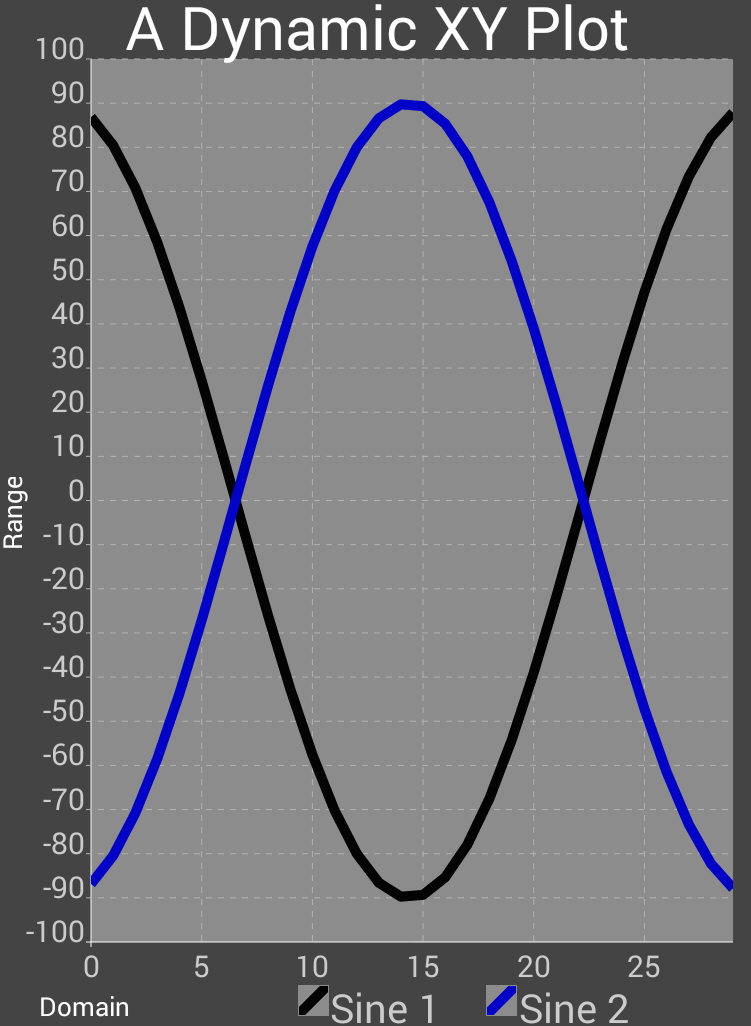
A Dynamic XY Plot
[doc_header]
[last_updated_for version=0.9.6]
Overview
This tutorial shows how to create a dynamic XYPlot consisting of two sine wave series with a phase and amplitude that varies at a specified frequency. Its taken from the
DemoApp's DynamicXYPlotActivity.
 |
layout/dynamicxyplot_example.xml
<?xml version="1.0" encoding="utf-8"?>
<LinearLayout xmlns:android="http://schemas.android.com/apk/res/android"
              xmlns:ap="http://schemas.android.com/apk/res-auto"
              style="@style/sample_activity">

    <com.androidplot.xy.XYPlot
        style="@style/simple_xy"
        android:id="@+id/dynamicXYPlot"
        android:layout_width="fill_parent"
        android:layout_height="fill_parent"
        androidplot.renderMode="use_background_thread"
        ap:label="A Dynamic XY Plot"
        ap:domainLabel="Domain"
        ap:rangeLabel="Range"
        ap:legendTextSize="15sp"
        ap:legendIconHeight="15dp"
        ap:legendIconWidth="15dp"
        ap:legendHeight="25dp"
        ap:legendAnchorPosition="right_bottom"/>

</LinearLayout>
DynamicXYPlotActivity.java
package com.androidplot.demos;
import android.app.Activity;
import android.graphics.Color;
import android.graphics.DashPathEffect;
import android.graphics.Paint;
import android.os.Bundle;
import com.androidplot.Plot;
import com.androidplot.util.PixelUtils;
import com.androidplot.xy.XYSeries;
import com.androidplot.xy.*;

import java.text.DecimalFormat;
import java.util.Observable;
import java.util.Observer;

public class DynamicXYPlotActivity extends Activity {

    // redraws a plot whenever an update is received:
    private class MyPlotUpdater implements Observer {
        Plot plot;

        public MyPlotUpdater(Plot plot) {
            this.plot = plot;
        }

        @Override
        public void update(Observable o, Object arg) {
            plot.redraw();
        }
    }

    private XYPlot dynamicPlot;
    private MyPlotUpdater plotUpdater;
    SampleDynamicXYDatasource data;
    private Thread myThread;

    @Override
    public void onCreate(Bundle savedInstanceState) {

        // android boilerplate stuff
        super.onCreate(savedInstanceState);
        setContentView(R.layout.dynamicxyplot_example);

        // get handles to our View defined in layout.xml:
        dynamicPlot = (XYPlot) findViewById(R.id.dynamicXYPlot);

        plotUpdater = new MyPlotUpdater(dynamicPlot);

        // only display whole numbers in domain labels
        dynamicPlot.getGraphWidget().setDomainValueFormat(new DecimalFormat("0"));

        // getInstance and position datasets:
        data = new SampleDynamicXYDatasource();
        SampleDynamicSeries sine1Series = new SampleDynamicSeries(data, 0, "Sine 1");
        SampleDynamicSeries sine2Series = new SampleDynamicSeries(data, 1, "Sine 2");

        LineAndPointFormatter formatter1 = new LineAndPointFormatter(
                                Color.rgb(0, 0, 0), null, null, null);
        formatter1.getLinePaint().setStrokeJoin(Paint.Join.ROUND);
        formatter1.getLinePaint().setStrokeWidth(10);
        dynamicPlot.addSeries(sine1Series,
                formatter1);

        LineAndPointFormatter formatter2 =
                new LineAndPointFormatter(Color.rgb(0, 0, 200), null, null, null);
        formatter2.getLinePaint().setStrokeWidth(10);
        formatter2.getLinePaint().setStrokeJoin(Paint.Join.ROUND);

        //formatter2.getFillPaint().setAlpha(220);
        dynamicPlot.addSeries(sine2Series, formatter2);

        // hook up the plotUpdater to the data model:
        data.addObserver(plotUpdater);

        // thin out domain tick labels so they dont overlap each other:
        dynamicPlot.setDomainStepMode(XYStepMode.INCREMENT_BY_VAL);
        dynamicPlot.setDomainStepValue(5);

        dynamicPlot.setRangeStepMode(XYStepMode.INCREMENT_BY_VAL);
        dynamicPlot.setRangeStepValue(10);

        dynamicPlot.setRangeValueFormat(new DecimalFormat("###.#"));

        // uncomment this line to freeze the range boundaries:
        dynamicPlot.setRangeBoundaries(-100, 100, BoundaryMode.FIXED);

        // create a dash effect for domain and range grid lines:
        DashPathEffect dashFx = new DashPathEffect(
                new float[] {PixelUtils.dpToPix(3), PixelUtils.dpToPix(3)}, 0);
        dynamicPlot.getGraphWidget().getDomainGridLinePaint().setPathEffect(dashFx);
        dynamicPlot.getGraphWidget().getRangeGridLinePaint().setPathEffect(dashFx);
    }
    @Override
    public void onResume() {
        // kick off the data generating thread:
        myThread = new Thread(data);
        myThread.start();
        super.onResume();
    }

    @Override
    public void onPause() {
        data.stopThread();
        super.onPause();
    }

    class SampleDynamicXYDatasource implements Runnable {

        // encapsulates management of the observers watching this datasource for update events:
        class MyObservable extends Observable {
            @Override
            public void notifyObservers() {
                setChanged();
                super.notifyObservers();
            }
        }

        private static final double FREQUENCY = 5; // larger is lower frequency
        private static final int MAX_AMP_SEED = 100;
        private static final int MIN_AMP_SEED = 10;
        private static final int AMP_STEP = 1;
        public static final int SINE1 = 0;
        public static final int SINE2 = 1;
        private static final int SAMPLE_SIZE = 30;
        private int phase = 0;
        private int sinAmp = 1;
        private MyObservable notifier;
        private boolean keepRunning = false;

        {
            notifier = new MyObservable();
        }

        public void stopThread() {
            keepRunning = false;
        }

        //@Override
        public void run() {
            try {
                keepRunning = true;
                boolean isRising = true;
                while (keepRunning) {

                    Thread.sleep(10); // decrease or remove to speed up the refresh rate.
                    phase++;
                    if (sinAmp >= MAX_AMP_SEED) {
                        isRising = false;
                    } else if (sinAmp <= MIN_AMP_SEED) {
                        isRising = true;
                    }

                    if (isRising) {
                        sinAmp += AMP_STEP;
                    } else {
                        sinAmp -= AMP_STEP;
                    }
                    notifier.notifyObservers();
                }
            } catch (InterruptedException e) {
                e.printStackTrace();
            }
        }

        public int getItemCount(int series) {
            return SAMPLE_SIZE;
        }

        public Number getX(int series, int index) {
            if (index >= SAMPLE_SIZE) {
                throw new IllegalArgumentException();
            }
            return index;
        }

        public Number getY(int series, int index) {
            if (index >= SAMPLE_SIZE) {
                throw new IllegalArgumentException();
            }
            double angle = (index + (phase))/FREQUENCY;
            double amp = sinAmp * Math.sin(angle);
            switch (series) {
                case SINE1:
                    return amp;
                case SINE2:
                    return -amp;
                default:
                    throw new IllegalArgumentException();
            }
        }

        public void addObserver(Observer observer) {
            notifier.addObserver(observer);
        }

        public void removeObserver(Observer observer) {
            notifier.deleteObserver(observer);
        }

    }

    class SampleDynamicSeries implements XYSeries {
        private SampleDynamicXYDatasource datasource;
        private int seriesIndex;
        private String title;

        public SampleDynamicSeries(SampleDynamicXYDatasource datasource, int seriesIndex, String title) {
            this.datasource = datasource;
            this.seriesIndex = seriesIndex;
            this.title = title;
        }

        @Override
        public String getTitle() {
            return title;
        }

        @Override
        public int size() {
            return datasource.getItemCount(seriesIndex);
        }

        @Override
        public Number getX(int index) {
            return datasource.getX(seriesIndex, index);
        }

        @Override
        public Number getY(int index) {
            return datasource.getY(seriesIndex, index);
        }
    }
}
What's Next?
Learn
how to plot sensor data in realtime.