Customizing the Legend
[doc_header]
[last_updated_for version=0.3d]
Overview
This doc will show you how the legend widget works and how to modify it to suit your needs.
A Basic Legend
A plot's legend widget is essentially a table. Each cell within the table is assigned a series from within the plot. The number of rows and columns of this table are configurable.
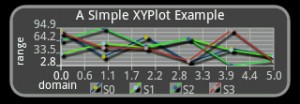
Let's start with a basic example of a plot with 4 series assigned to it. This is what it looks like:

Figure 1: A basic legend
layout/main.xml
<?xml version="1.0" encoding="utf-8"?>
<LinearLayout xmlns:android="http://schemas.android.com/apk/res/android"
    android:orientation="vertical"
    android:layout_width="fill_parent"
    android:layout_height="fill_parent">

    <com.androidplot.xy.XYPlot
    android:id="@+id/mySimpleXYPlot"
    android:layout_width="fill_parent"
    android:layout_height="100px"
    android:layout_marginTop="10px"
    android:layout_marginLeft="10px"
    android:layout_marginRight="10px"
    title="A Simple XYPlot Example"/>
</LinearLayout>
And here's the code:
MyActivity.java
package com.example;

import android.app.Activity;
import android.graphics.Color;
import android.os.Bundle;
import com.androidplot.ui.layout.SizeLayoutType;
import com.androidplot.ui.layout.SizeMetrics;
import com.androidplot.ui.layout.TableModel;
import com.androidplot.xy.SimpleXYSeries;
import com.androidplot.series.XYSeries;
import com.androidplot.xy.*;

import java.util.Arrays;
import java.util.Vector;

public class MyActivity extends Activity
{

    private XYPlot mySimpleXYPlot;

    @Override
    public void onCreate(Bundle savedInstanceState)
    {

        super.onCreate(savedInstanceState);
        setContentView(R.layout.main);

        // initialize our XYPlot reference:
        mySimpleXYPlot = (XYPlot) findViewById(R.id.mySimpleXYPlot);

        // randomly generate 4 series of data and add them to the plot.
        // values are all within the range of 0 - 100
        for (int i = 0; i < 4; i++) {
            Number[] seriesNumbers = {
                    Math.random() * 100,
                    Math.random() * 100,
                    Math.random() * 100,
                    Math.random() * 100,
                    Math.random() * 100,
                    Math.random() * 100};
            LineAndPointFormatter lpFormatter = new LineAndPointFormatter(
                            Color.rgb(
                                    new Double(Math.random()*255).intValue(),
                                    new Double(Math.random()*255).intValue(),
                                    new Double(Math.random()*255).intValue()),
                            Color.rgb(
                                    new Double(Math.random()*255).intValue(),
                                    new Double(Math.random()*255).intValue(),
                                    new Double(Math.random()*255).intValue()),
                            Color.rgb(
                                    new Double(Math.random()*255).intValue(),
                                    new Double(Math.random()*255).intValue(),
                                    new Double(Math.random()*255).intValue()));
            lpFormatter.setFillPaint(null);
            mySimpleXYPlot.addSeries(
                    new SimpleXYSeries(
                            Arrays.asList(seriesNumbers),           // SimpleXYSeries takes a List so turn our array into a List
                            SimpleXYSeries.ArrayFormat.Y_VALS_ONLY, // Y_VALS_ONLY means use the element index as the x value
                            "S" + i),
                    lpFormatter);                                   // Set the display title of the series);
        }

        mySimpleXYPlot.getLegendWidget().setSize(new SizeMetrics(11, SizeLayoutType.ABSOLUTE, 170, SizeLayoutType.ABSOLUTE));

        // reduce the number of range labels
        mySimpleXYPlot.setTicksPerRangeLabel(3);

        // by default, AndroidPlot displays developer guides to aid in laying out your plot.
        // To get rid of them call disableAllMarkup():
        mySimpleXYPlot.disableAllMarkup();

    }
}
Nothing wrong there. By default the legend widget has one row by n columns. Each of the n columns shares an equal amount of the available screen realestate assigned to the legend widget. But what if you don't one a single row of legend items? What if you want a 2 x 2 grid instead? Read on...
A 2x2 Legend Example
Working with the above code, let's make a few changes. First, we are going to need to expand our plot to give us more room to work with. Edit main.xml and give our XYPlot a height of 200 pixels:
Somewhere around line 62 add the following code:
        // use a 2x2 grid:
        mySimpleXYPlot.getLegendWidget().setTableModel(new DynamicTableModel(2, 2));

        // adjust the legend size so there is enough room
        // to draw the new legend grid:
        mySimpleXYPlot.getLegendWidget().setSize(new SizeMetrics(40, SizeLayoutType.ABSOLUTE, 75, SizeLayoutType.ABSOLUTE));

        // add a semi-transparent black background to the legend
        // so it's easier to see overlaid on top of our plot:
        Paint bgPaint = new Paint();
        bgPaint.setColor(Color.BLACK);
        bgPaint.setStyle(Paint.Style.FILL);
        bgPaint.setAlpha(140);
        mySimpleXYPlot.getLegendWidget().setBackgroundPaint(bgPaint);

        // adjust the padding of the legend widget to look a little nicer:
        mySimpleXYPlot.getLegendWidget().setPadding(10, 1, 1, 1);

        // reposition the grid so that it rests above the bottom-left
        // edge of the graph widget:
        mySimpleXYPlot.position(
                mySimpleXYPlot.getLegendWidget(),
                20,
                XLayoutStyle.ABSOLUTE_FROM_RIGHT,
                35,
                YLayoutStyle.ABSOLUTE_FROM_BOTTOM,
                AnchorPosition.RIGHT_BOTTOM);
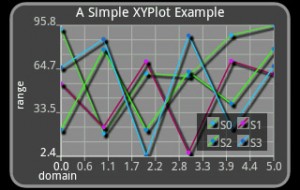
Which gives us this:

Figure 2: A 2x2 legend
Unbounded Grids
TODO
Row Major and Column Major Orientation
TODO


