Overview
This tutorial will walk you through Adding Androidplot as a dependency and displaying an XYPlot with two data series. You can view this sample on your own device or emulator by installing the
DemoApp on your device and clicking on the Simple XY Plot Example. Full source
available here.
This tutorial is also available in
video form on youtube.
Add the Dependency
To use the library in your gradle project add the following to your build.gradle:
dependencies {
    compile "com.androidplot:androidplot-core:0.9.8"
}
If you're using Proguard obfuscation (Projects created by Android Studio do by default) you'll also want add this to your proguard-rules.pro file:
-keep class com.androidplot.** { *; }
Add a Plot to the XML Layout
Once you've got the project skeleton created, it's time to edit
res/layout/simple_xy_plot_example.xml and add an XYPlot view. By default this file is usually named main.xml. If it is, go ahead and rename it.
res/layout/simple_xy_plot_example.xml
<LinearLayout xmlns:android="http://schemas.android.com/apk/res/android"
xmlns:ap="http://schemas.android.com/apk/res-auto"
android:layout_height="match_parent"
android:layout_width="match_parent">
<com.androidplot.xy.XYPlot
style="@style/APDefacto.Dark"
android:id="@+id/plot"
android:layout_width="fill_parent"
android:layout_height="fill_parent"
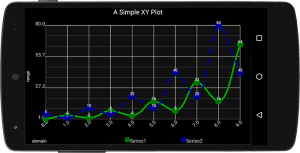
ap:label="A Simple XY Plot"
ap:rangeLabel="range"
ap:domainLabel="domain"/>
</LinearLayout>
This example uses a default style to decorate the plot. The full list of styleable attributes is
available here. While new attributes are added regularly, not all configurable properties are yet available. If something you need is missing, use the
Configurator.
Create the Activity
Let's look at an example Activity that displays the XYPlot graphic shown above. The basic steps to follow are:
- Create an instance of Series and populate it with data to be displayed.
- Register the series with the Plot along with a Formatter to describing how the data should be styled.
- Draw the Plot
In our case, since we are working with XY data, we'll be using an XYPlot, a SimpleXYSeries (which is an implementation of the XYSeries interface) and a LineAndPointFormatter.
SimpleXYPlotActivity.java
import android.app.Activity;
import android.graphics.DashPathEffect;
import android.os.Bundle;
import com.androidplot.util.PixelUtils;
import com.androidplot.xy.SimpleXYSeries;
import com.androidplot.xy.XYSeries;
import com.androidplot.xy.*;
import java.util.Arrays;

/**
 * A simple XYPlot
 */
public class SimpleXYPlotActivity extends Activity
{

    private XYPlot plot;

    @Override
    public void onCreate(Bundle savedInstanceState)
    {
        super.onCreate(savedInstanceState);
        setContentView(R.layout.simple_xy_plot_example);

        // initialize our XYPlot reference:
        plot = (XYPlot) findViewById(R.id.plot);

        // create a couple arrays of y-values to plot:
        Number[] series1Numbers = {1, 4, 2, 8, 4, 16, 8, 32, 16, 64};
        Number[] series2Numbers = {5, 2, 10, 5, 20, 10, 40, 20, 80, 40};

        // turn the above arrays into XYSeries':
        // (Y_VALS_ONLY means use the element index as the x value)
        XYSeries series1 = new SimpleXYSeries(Arrays.asList(series1Numbers),
                SimpleXYSeries.ArrayFormat.Y_VALS_ONLY, "Series1");

        XYSeries series2 = new SimpleXYSeries(Arrays.asList(series2Numbers),
                SimpleXYSeries.ArrayFormat.Y_VALS_ONLY, "Series2");

        // create formatters to use for drawing a series using LineAndPointRenderer
        // and configure them from xml:
        LineAndPointFormatter series1Format = new LineAndPointFormatter();
        series1Format.setPointLabelFormatter(new PointLabelFormatter());
        series1Format.configure(getApplicationContext(),
                R.xml.line_point_formatter_with_labels);

        LineAndPointFormatter series2Format = new LineAndPointFormatter();
        series2Format.setPointLabelFormatter(new PointLabelFormatter());
        series2Format.configure(getApplicationContext(),
                R.xml.line_point_formatter_with_labels_2);

        // add an "dash" effect to the series2 line:
        series2Format.getLinePaint().setPathEffect(
                new DashPathEffect(new float[] {

                        // always use DP when specifying pixel sizes, to keep things consistent across devices:
                        PixelUtils.dpToPix(20),
                        PixelUtils.dpToPix(15)}, 0));

        // just for fun, add some smoothing to the lines:
        // see: http://androidplot.com/smooth-curves-and-androidplot/
        series1Format.setInterpolationParams(
                new CatmullRomInterpolator.Params(10, CatmullRomInterpolator.Type.Centripetal));

        series2Format.setInterpolationParams(
                new CatmullRomInterpolator.Params(10, CatmullRomInterpolator.Type.Centripetal));

        // add a new series' to the xyplot:
        plot.addSeries(series1, series1Format);
        plot.addSeries(series2, series2Format);

        // reduce the number of range labels
        plot.setTicksPerRangeLabel(3);

        // rotate domain labels 45 degrees to make them more compact horizontally:
        plot.getGraphWidget().setDomainLabelOrientation(-45);

    }
}
res/xml/line_point_formatter_with_labels.xml
<?xml version="1.0" encoding="utf-8"?>
<config
    linePaint.strokeWidth="5dp"
    linePaint.color="#00AA00"
    vertexPaint.color="#007700"
    vertexPaint.strokeWidth="20dp"
    fillPaint.color="#00000000"
    pointLabelFormatter.textPaint.color="#FFFFFF"/>
res/xml/line_point_formatter_with_labels_2.xml
<?xml version="1.0" encoding="utf-8"?>
<config
    linePaint.strokeWidth="5dp"
    linePaint.color="#0000AA"
    vertexPaint.strokeWidth="20dp"
    vertexPaint.color="#000099"
    fillPaint.color="#00000000"
    pointLabelFormatter.textPaint.color="#FFFFFF"/>
One potentially confusing section of the code above is LineAndPointFormatter and the usage of configure(...). This is actually more
Configurator magic. While it's possible to programmatically create and configure Formatter instances (such as LineAndPointFormatter) doing so leads to a brittle visual experience. Never the less for the sake of brevity, one could replace the code:
LineAndPointFormatter series1Format = new LineAndPointFormatter();
        series1Format.setPointLabelFormatter(new PointLabelFormatter());
        series1Format.configure(getApplicationContext(),
                R.xml.line_point_formatter_with_plf1);
with:
LineAndPointFormatter series1Format = new LineAndPointFormatter(Color.RED, Color.GREEN, Color.BLUE, null);
For more details on how to programmatically configure Formatters etc. consult the latest Javadocs.
What's Next?
Now that you know the basics you're ready to start
plotting dynamic data.
