Styling Your Plot
[last_updated_for version=0.6.0]
Overview
This document gives an overview of the anatomy of a Plot, which elements are responsible for doing what and how each of these things can be customized.
Anatomy of a Plot
Each Plot implementation defines what kind of Series data it accept, maintains a registry of those Series and their associations with various Formatters, known as the SeriesRegistry and a collection of UI elements used to visualize that data encapsulated by the
LayoutManager class.
The SeriesRegistry
The SeriesRegistry is an ordered list of all Series data to be rendered by a Plot, along with an association between each entry and a Formatter, the pair of which map the Series to a specific Renderer. How exactly the SeriesRegistry is implemented gets a little complicated and while not currently it's own class but rather a member of the Plot class, it's worth being aware of a few key properties of the SeriesRegistry:
- The same Series can be (and in practice often is) added multiple times with different Formatters.
- Duplicate entries are also allowed but have no positive value.
- The order in which a Series is added determines it's Z-Indexing when the Plot is rendered.
- Z-Reindexing is currently only possible by first removing, then adding a Series to bring it to the top.
- The Renderer to be used for a given Series/Formatter pair is determined by the Formatter type.
- Only a single Renderer instance per Renderer type is ever instantiated per Plot. It is reused by all associated Series/Formatter pairs within the owning Plot.
- Renderers are instantiated on demand.
- Once instantiated, a Renderer instance remains in memory for the duration of it's owning Plot's life.
Renderers
TODO
Formatters
TODO
The LayoutManager
The LayoutManger can be thought of an empty space inside of which graphical elements can be arranged. Androidplot calls these graphical elements "Widgets". The LayoutManager provides methods for adding, removing and retrieving Widgets, for positioning Widgets relative to the boundaries of the LayoutManager and finally above or beneath the other Widgets. When a Plot is drawn, LayoutManager computes the sizes of each Widget, decides the order in which each will be drawn and finally draws each widget in order onto the Plot's canvas.
Every Plot has a LayoutManager and it can be accessed via the
getLayoutManager() method. As of version 0.6.0 use of the LayoutManager to manipulate Widgets outside of adding custom Widgets or removing unwanted ones has been deprecated in favor of directly accessing a Plot's widgets via it's getter method. To this end, the
position(..) methods previously found within the LayoutManager have been relocated to the Widget base class. More on this later.
Widgets
If the LayoutManager were a refrigerator then Widgets would be the refrigerator magnets; they exist within the space defined by LayoutManager and you can't nest one Widget inside another. These Widgets contain the bulk of the code that handles rendering and consequently it is the individual Widgets that control the various Paint instances and text strings used during rendering. If for example you are working with an XYPlot and want to alter it's graph lines then you'd first need to retrieve the Plot's XYGraphWidget instance via
XYPlot.getGraphWidget().
Markup Mode
Before continuing, lets take a quick moment to learn about Markup Mode as this knowledge will prove useful in the coming sections.
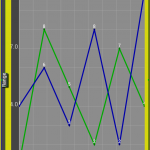
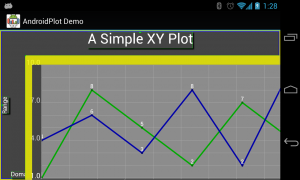
One of the cool things LayoutManager is able to do as a result of being at the root of all drawing operations within a Plot is to optionally draw guides around each Widget highlighting its boundaries, margins, padding and hints about z-indexing in the form of shadowing. Being able to see these values turns out to be quite useful for debugging the visual layout of a Plot. This mode can be turned on and off via the
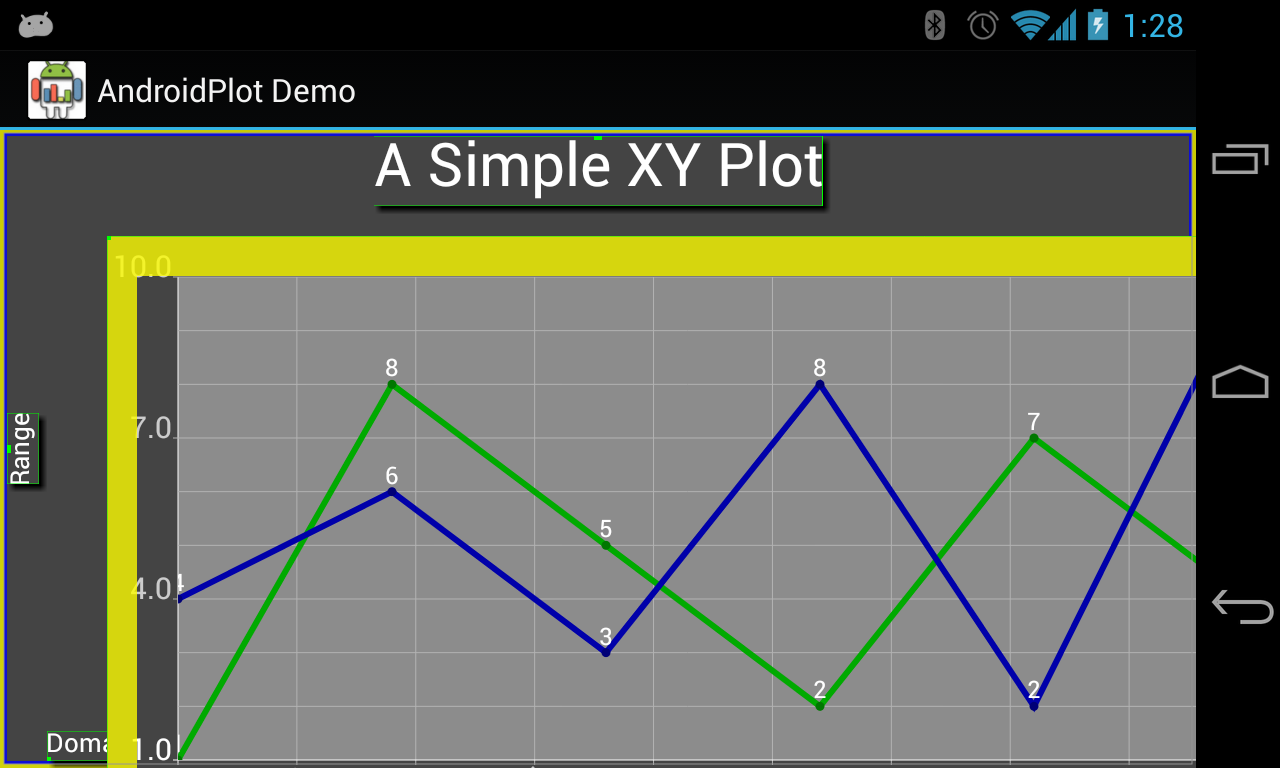
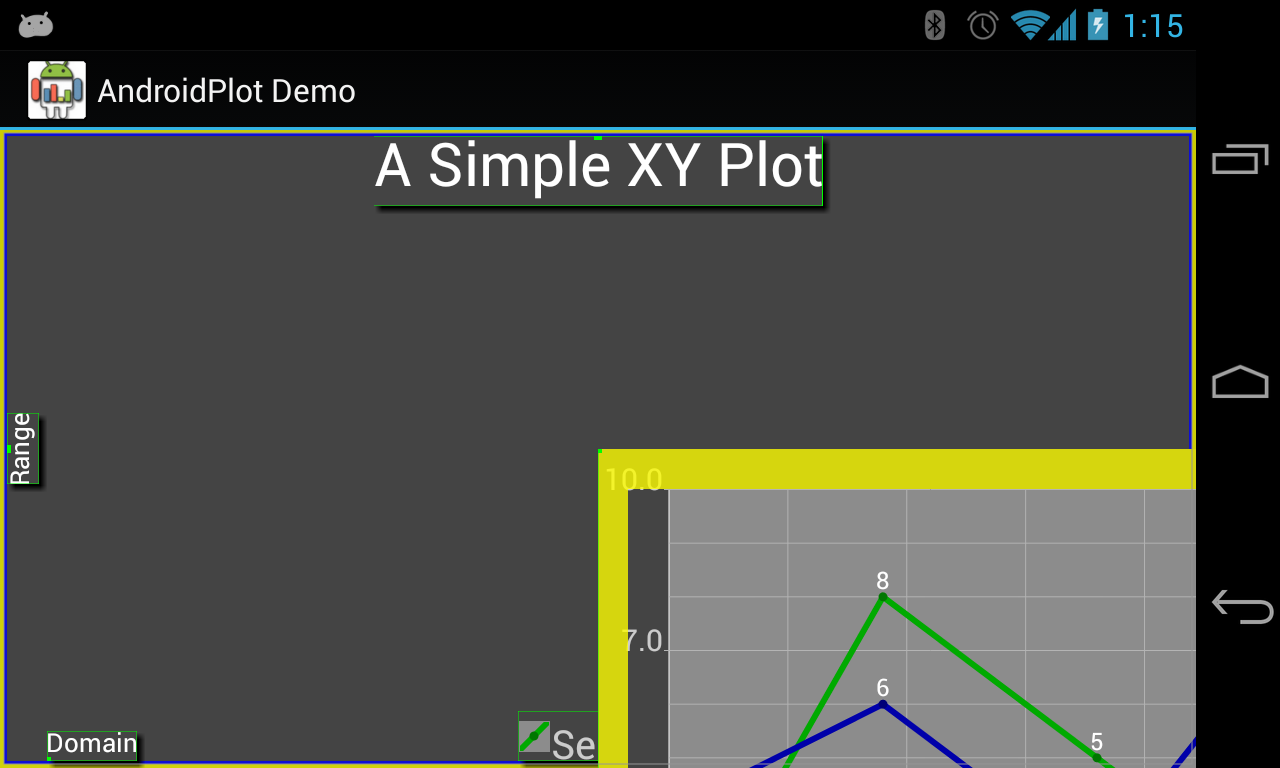
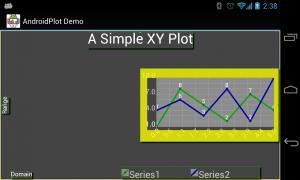
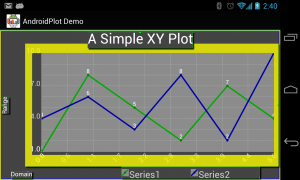
setMarkupEnabled(boolean) method. It's also available as the convenience method from within Plot directly. Here's a before and after look at the Simple XY Plot Example with Markup Mode enabled:
-
-
without markup
-
-
with markup
If you are curious about what the different colors mean or the details of how and where margins and padding are applied then take a look at
Borders, Margins and Padding. It's one of the older docs but the information is still valid.
X/Y-Positioning Widgets
There are several ways to position Widgets within a Plot. The
standard position method takes 5 arguments; an x-position, an x-layout style, a y-position, a y-layout style and an anchor point. The Javadoc incorrectly notes that the x/y position params are relative to the top-left corner of the Widget. They are actually relative to whatever anchor point is set as the 5th parameter.
The x/y position values specify a numeric position value for the corresponding axis, relative to the specified anchor point. Its worth noting at this point that these are screen coordinates so the upper left corner of the Plot space is [0,0] and extends positively going down and to the right. The unit type of the x/y position value depends on it's corresponding layout style. The x and y layout style params are expressed are of the Enum type
XLayoutStyle and
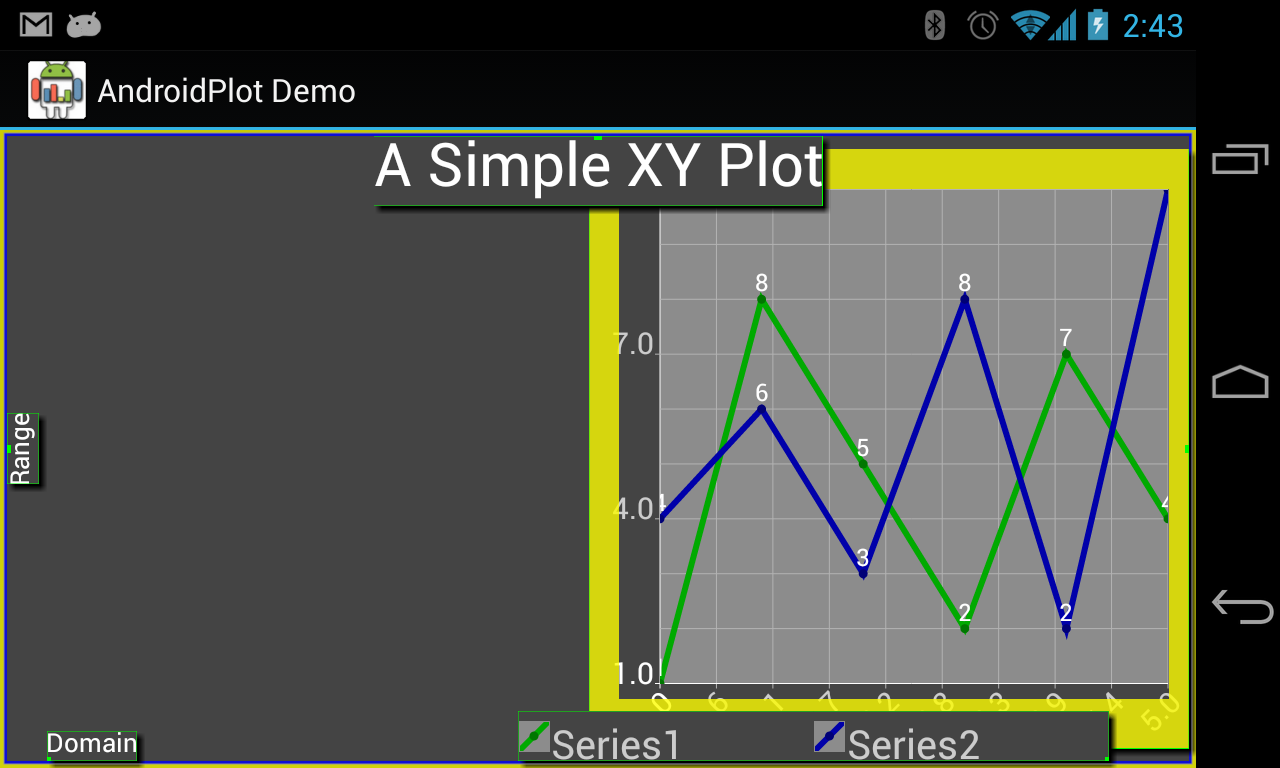
YLayoutStyle respectively and contain values for specifying a position in reference to an outer edge or center of the Plot space either as an absolute or relative value. What all this means becomes clear after looking at a couple examples. Using the Simple XYPlot Example above, let's apply some custom positioning to the XYGraphWidget and take a look at the effects:
Example #1
plot.getGraphWidget().position(
                100, XLayoutStyle.ABSOLUTE_FROM_LEFT,
                100, YLayoutStyle.ABSOLUTE_FROM_TOP,
                AnchorPosition.LEFT_TOP);
Example #2
plot.getGraphWidget().position(
                100, XLayoutStyle.ABSOLUTE_FROM_CENTER,
                100, YLayoutStyle.ABSOLUTE_FROM_CENTER,
                AnchorPosition.LEFT_TOP);
Example #3
plot.getGraphWidget().position(
                -0.5f, XLayoutStyle.RELATIVE_TO_LEFT,
                -0.5f, YLayoutStyle.RELATIVE_TO_TOP,
                AnchorPosition.LEFT_TOP);
Example #4
plot.getGraphWidget().position(
                -0.5f, XLayoutStyle.RELATIVE_TO_RIGHT,
                -0.5f, YLayoutStyle.RELATIVE_TO_BOTTOM,
                AnchorPosition.LEFT_TOP);

Z-Positioning Widgets
Z-Positioning refers to the relative positioning of Widgets "above" or "beneath" one another. There are several ways to do this:
- Bring a Widget to the front or send it the back via LayoutManager's moveToTop(Widget) & moveToBottom(Widget) methods.
- Move a Widget up or down via LayoutManager's moveUp(Widget) & moveDown(Widget) methods.
- Move a Widget in front of or behind another Widget via LayoutManagers moveAbove(Widget, Widget) & moveBeneath(Widget, Widget) methods.
Sizing Widgets
Sizing is accomplished via the
Widget.setSize(SizeMetrics) method. If you take a look at the various SizeMetrics constructors you'll notice a lot of similarities to how Widget positioning is handled. Essentially, you specify an height, a height style, a width and a width style. The style value specified determines the unit type of the corresponding numeric value. These style params are of the Enum type
SizeLayoutType which has 3 elements:
- ABSOLUTE - size param represents pixels
- FILL - size param is subtracted from the Plot space total size for the given dimension. The difference is the Widget size.
- RELATIVE - size param represents ratio of the Widget to the Plot space, in the range of 0 (0%) to 1 (100%).
Once again let's take a look at a few examples to see how this works:
Example #1:
plot.getGraphWidget().setSize(new SizeMetrics(
                50, SizeLayoutType.RELATIVE,
                50, SizeLayoutType.RELATIVE));
Example #2:
plot.getGraphWidget().setSize(new SizeMetrics(
                100, SizeLayoutType.FILL,
                100, SizeLayoutType.FILL));
Example #3:
plot.getGraphWidget().setSize(new SizeMetrics(
                600, SizeLayoutType.ABSOLUTE,
                600, SizeLayoutType.ABSOLUTE));

Next Steps
How to style your plot to support multiple screen shapes and densities using
Configurator.