Using Log Notation
[doc_header]
[last_updated_for version=0.5.1]
Overview
This is a quick look at how to plot using Log notation.
Log Values
package com.example;

import com.androidplot.xy.XYStepMode;
import android.app.Activity;
import android.graphics.Color;
import android.os.Bundle;
import com.androidplot.series.XYSeries;
import com.androidplot.xy.LineAndPointFormatter;
import com.androidplot.xy.XYPlot;

import java.text.DecimalFormat;
import java.text.FieldPosition;
import java.text.NumberFormat;
import java.text.ParsePosition;

public class MyActivity extends Activity {

    @Override
    public void onCreate(Bundle savedInstanceState) {
        super.onCreate(savedInstanceState);
        setContentView(R.layout.main);

        // some y-values to be plotted.  in this example these values are already log values:
        XYSeries s1 = new XYSeries() {

            private Number[] yVals = {0, 1, 2, 3, 2, 4, 3, 2, 3, 2, 1};

            // x == i
            @Override
            public Number getX(int index) {
                return index;
            }

            @Override
            public Number getY(int index) {
                return yVals[index];
            }

            @Override
            public String getTitle() {
                return "Series 1";
            }

            @Override
            public int size() {
                return yVals.length;
            }
        };

        XYPlot plot = (XYPlot) findViewById(R.id.myPlot);
        plot.addSeries(s1, new LineAndPointFormatter(Color.BLACK, null, null));

        // set domain value labels to increment by 1 on each tick
        plot.setDomainStep(XYStepMode.INCREMENT_BY_VAL, 1);
        plot.setDomainValueFormat(new DecimalFormat("00"));

        // set range value labels to increment by one on each tick
        plot.setRangeStep(XYStepMode.INCREMENT_BY_VAL, 1);

        plot.setRangeValueFormat(new NumberFormat() {
            // use engineering notation
            DecimalFormat df = new DecimalFormat("00E00");

            @Override
            public StringBuffer format(double v, StringBuffer stringBuffer, FieldPosition fieldPosition) {
                // expand the log back out to it's original value before passing into df:
                // note that this is a very inefficient way of doing things, but its easier
                // to understand for the sake of this example.
                return df.format(Math.pow(10, v), stringBuffer, fieldPosition);
            }

            // unused
            @Override
            public StringBuffer format(long l, StringBuffer stringBuffer, FieldPosition fieldPosition) { return null;}

            // unused
            @Override
            public Number parse(String s, ParsePosition parsePosition) { return null;}
        });
    }
}
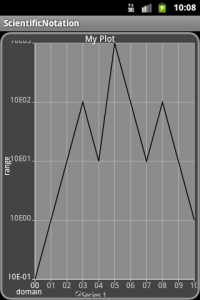
produces this:

Raw Values
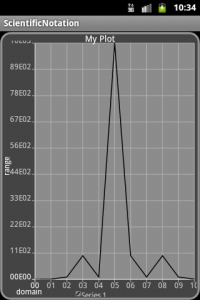
In this example we plot raw y-vals using the same log labeling but because the yVals are raw, there is no log scaling applied.
package com.example;

import com.androidplot.xy.XYStepMode;
import android.app.Activity;
import android.graphics.Color;
import android.os.Bundle;
import com.androidplot.series.XYSeries;
import com.androidplot.xy.LineAndPointFormatter;
import com.androidplot.xy.XYPlot;

import java.text.DecimalFormat;
import java.text.FieldPosition;
import java.text.NumberFormat;
import java.text.ParsePosition;

public class MyActivity extends Activity {

    @Override
    public void onCreate(Bundle savedInstanceState) {
        super.onCreate(savedInstanceState);
        setContentView(R.layout.main);

        // some y-values to be plotted.  in this example these are raw values:
        XYSeries s1 = new XYSeries() {

            private Number[] yVals = {0, 10, 100, 1000, 100, 10000, 1000, 100, 1000, 100, 10};

            // x == i
            @Override
            public Number getX(int index) {
                return index;
            }

            @Override
            public Number getY(int index) {
                return yVals[index];
            }

            @Override
            public String getTitle() {
                return "Series 1";
            }

            @Override
            public int size() {
                return yVals.length;
            }
        };

        XYPlot plot = (XYPlot) findViewById(R.id.myPlot);
        plot.addSeries(s1, new LineAndPointFormatter(Color.BLACK, null, null));

        // set domain value labels to increment by 1 on each tick
        plot.setDomainStep(XYStepMode.INCREMENT_BY_VAL, 1);
        plot.setDomainValueFormat(new DecimalFormat("00"));

        plot.setRangeValueFormat(new DecimalFormat("00E00"));
    }
}


